IND

Trending Now

Stock market

IFCI Share Price Today Live Updates: IFCI Stock Gains in Today Trading.

IFCI Share Price went up today, 06 May 2024, by 1.69 %. The stock closed at 52.51 per share. The stock is currently trading at 53.4 per share. Investors should monitor IFCI stock price closely in the coming days and weeks to see how it reacts to the news.

IFCI Share Price Today: On the last day of trading, IFCI’s open price was ₹54.99 and the close price was ₹52.51. The high for the day was ₹54.99 and the low was ₹51.70. The market capitalization of IFCI stood at ₹13,980.1 crore. The 52-week high for the stock was ₹71.70, and the 52-week low was ₹10.95. The BSE volume for IFCI was 4,977,411 shares traded.

IFCI share price live: Simple Moving Average

DaysSimple Moving Average
5 Days48.24
10 Days45.09
20 Days45.00
50 Days44.75
100 Days41.20
300 Days30.17

IFCI Short-Term and Long-Term Trends

As per the Technical Analysis, the short-term trend of IFCI share is Bullish and the long-term trend is Bullish

IFCI share price Today: Volume traded till 2 PM is -62.74% lower than yesterday

The volume of IFCI traded until 2 PM is 62.74% lower than yesterday, with the price trading at ₹52.98, a decrease of 0.9%. Volume traded is a crucial factor, along with price, for analyzing trends. A positive price movement accompanied by higher volume indicates a sustainable upward trend, while a negative price movement with higher volume could signal further price declines.

IFCI share price Live: Hourly Price Movement Update

IFCI reached a peak of 53.6 and a low of 52.42 in the previous trading hour. In the last hour, the stock price surpassed the hourly resistance at 53.05 (Resistance level 1), suggesting bullish momentum.
The hourly support and resistance levels to watch out for in the next hour are mentioned below.

Resistance LevelsPriceSupport LevelsPrice
Resistance 153.76Support 152.58
Resistance 254.27Support 251.91
Resistance 354.94Support 351.4

IFCI share price update: IFCI is trading at ₹53.4, up 1.69% from yesterday’s ₹52.51

IFCI share price is at ₹53.4 and is still trading between the key support and resistance levels of ₹51.15 and ₹54.5 on a daily timeframe. If it crosses the support of ₹51.15 then we can expect a further bearish movement. On the other hand, if the price crosses 54.5 then it will lead to a bullish movement.

IFCI share price NSE Live: Volume traded till 1 PM is -63.72% lower than yesterday

The volume of IFCI traded until 1 PM is down by 63.72% compared to yesterday, with the price trading at ₹53.28, a decrease of 1.47%. Volume traded is a key indicator, along with price, for analyzing trends. A positive price trend accompanied by increased volume indicates a sustainable upward movement, while a negative price trend with higher volume could signal further price declines.

IFCI share price Today: Hourly Price Movement Update

IFCI’s stock traded between 53.25 and 52.65 in the previous hour. The price fell below key hourly resistances of 53.02 and 52.84, suggesting notable selling pressure. Traders holding long positions may consider exiting, while new investors can assess the possibility of a reversal if the stock is oversold on an hourly basis.
The hourly support and resistance levels to watch out for in the next hour are mentioned below.

Resistance LevelsPriceSupport LevelsPrice
Resistance 153.05Support 152.45
Resistance 253.45Support 252.25
Resistance 353.65Support 351.85

IFCI share price NSE Live: Hourly Price Movement Update

The stock price has been moving between the levels of 53.69 and 52.91 in the last hour. Traders could consider utilizing rangebound trading strategies by purchasing near the hourly support at 52.91 and selling near the hourly resistance at 53.69.
The hourly support and resistance levels to watch out for in the next hour are mentioned below.

Resistance LevelsPriceSupport LevelsPrice
Resistance 153.47Support 153.02
Resistance 253.74Support 252.84
Resistance 353.92Support 352.57

IFCI Short-Term and Long-Term Trends

As per the Technical Analysis, the short-term trend of IFCI share is Bullish, and the long-term trend is Bullish

IFCI share price live: Simple Moving Average

DaysSimple Moving Average
5 Days48.24
10 Days45.09
20 Days45.00
50 Days44.75
100 Days41.20
300 Days30.17

Indegene IPO opens GMP, subscription status, review, price, date, lot size, and other details. Apply or not?

IFCI share price update: IFCI is trading at ₹53.22, up 1.35% from yesterday’s ₹52.51

IFCI share price is at ₹53.22 and is still trading between the key support and resistance levels of ₹51.15 and ₹54.5 on a daily timeframe. If it crosses the support of ₹51.15 then we can expect a further bearish movement. On the other hand, if the price crosses 54.5 then it will lead to a bullish movement.

IFCI share price NSE Live: Volume traded till 11 AM is -62.36% lower than yesterday

The volume of IFCI traded by 11 AM is 62.36% lower than the previous day, with the price at ₹53.24, down by 1.39%. Volume traded is a key indicator, along with price, for analyzing trends. A price rise accompanied by increased volume indicates a sustainable upward trend, while a drop in price with higher volume could signal further price declines.

IFCI share price Today: Hourly Price Movement Update

The stock price has been moving between 53.89 and 51.84 levels in the last hour. Traders may want to consider rangebound trading strategies by buying near the hourly support at 51.84 and selling near the hourly resistance at 53.89.
The hourly support and resistance levels to watch out for in the next hour are mentioned below.

Resistance LevelsPriceSupport LevelsPrice
Resistance 153.69Support 152.91
Resistance 254.05Support 252.49
Resistance 354.47Support 352.13

IFCI share price Live: IFCI closed at ₹52.51 on last trading day & the technical trend suggests Bullish near term outlook

The stock traded in the range of ₹54.99 & ₹51.7 yesterday to end at ₹52.51. The stock is currently experiencing a strong bullish trend

Federal Bank Share Price LIVE: stock down 1.82%. Catch the closing action Live here.

Live Stock Price for Federal Bank Ltd.: The shares of Federal Bank Ltd. saw a decrease of 1.82% to ₹165.15, indicating a market capitalization of ₹40.18 Thousand Crore. Thus far, the Federal Bank Ltd. stock has experienced a high of ₹169.50 and a low of ₹164.00. In the past year, the stock has fluctuated between ₹170.30 and ₹121.00. The stock performance, peer returns, historical information, and other insights of Federal Bank Ltd. are demonstrated here.

Federal Bank is trading -1.37% lower at Rs 165.70 as compared to its last closing price. Federal Bank has been trading in the price range of 169.50 & 164.00. Federal Bank has given 7.59% in this year & 9.38% in the last 5 days.

Federal Bank has a TTM P/E ratio of 8.95 as compared to the sector P/E of 9.31.30 analysts have initiated coverage on Federal Bank. 15 analysts have given it a strong buy rating & 8 analysts have given it a buy rating. 0 analysts have given the stock a sell rating.

The company posted a net profit of 1,035.42 Crores in its last quarter.

Hindalco vs Vedanta: Which metal stock should you pick for the long term?

Listed peers of Federal Bank include Au Small Finance Bank (0.02%), Punjab & Sind Bank (-2.43%), Federal Bank (-1.37%) etc.

Federal Bank has a 100.00% public holding. The Mutual Fund holding in Federal Bank was at 9.11% on 31 Mar 2024. The MF holding has increased from the last quarter. The FII holding in Federal Bank was at 28.57% on 31 Mar 2024. The FII holding has decreased from the last quarter.

Federal Bank share price range

Today’s Low164.00Today’s High169.50
52 Week Low120.9052 Week High170.25

Federal Bank Share Key Metrics

Market Cap ( ₹ Cr.)40,926.23

Beta1.48
Div. Yield (%)0.00
P/B1.36
D/E0.84
Open Price168.15
TTM P/E8.95
Peg. Ratio4.77
Sector P/E9.31
Prev. Close168.00

Federal Bank stock Analysis

Price Analysis

1 Week9.38%
3 Months14.40%
6 Month18.77%
YTD7.59%
1 Year22.00%

Federal Bank

Analysts’ Views

RatingsCurrent1 W Ago1 M Ago3 M Ago
Strong Buy15151515
Buy8888
Hold6556
Sell0000
Strong Sell1111
Total30292930

Technical Trends

Federal Bank

The value of Federal Bank’s shares has dropped by 1.82%, according to real-time tracking. Investors can learn a lot from this closing behavior, which signals changes in market mood and possible future trends. Real-time monitoring of these variations can help stakeholders make well-informed decisions about their investment plans. Keep checking back for more information and analysis to help you successfully navigate the ever-changing stock market landscape.

Hindalco vs Vedanta: Which metal stock should you pick for the long term?

Stock Price Trend: Vedanta has outperformed benchmark Nifty Metal this year so far while Hindalco underperformed. Vedanta has surged over 61 percent in 2024 YTD while Hindalco is up just 5 percent. The metals market has seen a strong performance driven by positive PMI data from China and solid US economic fundamentals, leading to higher commodity prices, especially for base metals. Hindalco and Vedanta’s comparison can help identify better long-term investment opportunities.

The metals market has experienced a strong performance in the past month, largely due to positive PMI data from China and solid economic fundamentals in the US. This has driven up commodity prices, particularly for base metals. Supply constraints in copper and aluminum, alongside a ban on Russian-origin metal from the London Metal Exchange, have further supported metal prices. With the potential for interest rate cuts from the Federal Reserve and an anticipated stimulus from China, the outlook for metals remains positive.

In this environment, comparing Hindalco and Vedanta can help determine which metal stock may offer superior long-term investment opportunities.

Coforge share price declines 9% post-Q4 earnings performance: Should you sell or Hold the stock?

Stock Price Trend

Vedanta has outperformed benchmark Nifty Metal this year so far while Hindalco underperformed. Vedanta has surged over 61 percent in 2024 YTD while Hindalco is up just 5 percent. In comparison, the Nifty Metal index has gained over 17 percent in this period.

This year so far, Vedanta has given positive returns in 3 of the 4 completed months so far while Hindalco has been positive in 2. Vedanta rallied 46.46 percent in April after a 1.3 percent rise in March. Meanwhile, it fell 2.5 percent in February but rose 6.4 percent in January this year. In the 2 sessions of May, the stock has advanced 5.3 percent.

Hindalco, on the other hand, gained 15 percent in April, extending gains for the 2nd straight month, after a 11.19 percent surge in March. However, it fell in the first 2 months of this year, down 5.7 percent in January and 13 percent in February. It has been flat, up just half a percent in May.

Meanwhile, in the last 1 year as well, Vedanta has been the better stock, jumping around 50 percent whereas Hindalco has rallied 45 percent. In comparison, Nifty Metal has surged 110 percent in this time.

Both Vedanta and Hindalco have also hit their 52-week highs in recent times along with Nifty Metal. Vedanta hit its 52-week high of ₹419 in intra-day deals today, May 3, 2024. The stock has now advanced 101.5 percent from its 52-week low of ₹207.85, hit on September 28, 2023.

Meanwhile, Hindalco touched its all-time high of ₹661.30 last month on April 26, 2024, and is currently just 2 percent away from the peak. Currently trading at ₹646, it has rallied over 64 percent from its 52-week low of ₹398.00, hit on May 25, 2023.

Moreover, in the long term, 3 years, again Hindalco has emerged as the winner. It has surged 78 percent while Vedanta jumped 61 percent.

Gold Rate Today Falls In India: Check 22 Carat Price In All City On 01 May.

Earnings

In the March quarter, Vedanta reported a 27 percent decline in its net profit to ₹1,369 crores on the back of surging finance costs and weak prices of metals such as zinc, copper, and aluminum. It had posted a net profit of ₹1,881 crore in the same period last year. Meanwhile, its revenue from operations fell 6 percent YoY to ₹34,937 crore in Q4FY24.

The company said that short-term and long-term demand remains robust in India. “The demand is expected to remain strong in upcoming years due to thriving infrastructure, manufacturing, automobile, and EV/renewable sectors,” Vedanta said in an investor presentation.

The top 10 stocks to buy today, April 29, are IDFC First Bank, Tata Chemicals, Maruti Suzuki, ICICI Bank, Britannia, HCL Tech, and SBI Card.

Meanwhile, Hindalco has not yet reported its March quarter results. In the December quarter, the firm reported a 71 percent YoY growth in its consolidated net profit at ₹2,331 crore versus ₹1,362 crore a year ago. Meanwhile, its revenue from operations in the third quarter fell marginally to ₹52,808 crore from ₹53,151 crore in the same quarter of last year.

“The copper business registered a record EBITDA, up 20 percent YoY on the back of strong volume growth and robust operations,” Hindalco managing director Satish Pai said.

The aluminum upstream business EBITDA rose 54 percent from the year-ago period, supported by stable operations and lower raw material costs, “which keeps us positioned in the first quartile of the global cost curve”, he said.

Nifty 50 and Sensex today: What we can expect from the Indian stock market on April 29th.

Which metal stock has better long-term investment opportunities?

Sanjay Moorjani, Research Analyst, Samco Securities likes Hindalco better

Incorporated in 1958, Hindalco Industries Limited is the metals flagship company of the Aditya Birla Group. Now, Hindalco is advancing from a manufacturing company to a manufacturing solutions provider by moving further down the value chain and co-creating solutions with customers. The company has announced organic growth investments of around $1.13 Billion which are planned to be allocated to high-growth downstream projects in Electric Vehicles (EVs), e-mobility, packaging, batteries, building and construction and consumer durables. India’s growth story remains strong on account of increased focus by the government on infrastructure, railways, defence and manufacturing. 

Additionally, the government’s rooftop solar scheme will serve as another tailwind for Hindalco along with the already growing EV market. These futuristic sectors are expected to see a lot of traction going forward and Hindalco’s downstream initiatives position it to capitalise on these opportunities fully.

On the other hand, Vedanta is one of the world’s leading natural resources companies spanning across India, South Africa, Namibia, Liberia, UAE, Korea, Taiwan and Japan with significant operations in Oil & Gas, Zinc, Lead, Silver, Copper, Iron Ore, Steel, Nickel, Aluminium, Power & Glass Substrate and foraying into electronics and display glass manufacturing. The proposed demerger in Vedanta would present an opportunity for investors to invest in individual businesses independently, essentially creating pure-play investment options. 

Tech Mahindra stock hits the upper circuit by 10%, Following Q4 results; see the share price target

However, it’s crucial to note that Vedanta’s debt obligations persist despite this structural change. Additionally, while Vedanta’s shares have experienced notable rallies in recent times, operational performance improvements haven’t seen any positive surprises. However, the debt obligations of Vedanta would remain unaffected. In the last month, Vedanta’s shares have rallied a lot without much of an improvement in its operational performance.

While both Hindalco and Vedanta present compelling investment propositions, Hindalco’s strategic focus on downstream initiatives aligned with futuristic sectors positions it as a promising long-term investment choice. Investors can consider Vedanta’s businesses post its demerger.

Parthiv Jhonsa, Lead Analyst (Metal and Mining), Anand Rathi Institutional Equities also picked Hindalco over Vedanta

Hindalco has a strong aluminium and copper presence in the domestic market along with being one of the largest FRP producers globally (excl. China). As India is the only major economy where domestic demand for metals is expected to outstrip global growth figures, Hindalco is well-set in the non-ferrous sector, especially after the supply crunch caused by the ban on Russian metals in North America and the recent rally in copper.

HUDCO shares jumped 15% to a record high, while multi-bagger PSU stock has increased 369% in just a year.

Sujit Modi, CIO, Share.Market, as well, favours Hndalco

A head-to-head comparison between the two stocks based on our factors tells us that both the stocks rank high on short-term measures like Momentum and Sentiment, however, in the longer time frame, factors like Quality & Value seem to favor Hindalco over Vedanta.

On the contrary, Aditya Welekar, Senior Research Analyst – Auto & Metals, Axis Securities prefers Vedanta over Hindalco

In the long term, we prefer Vedanta over Hindalco as Vedanta has multiple levers to grow both in volume and cost/operational performance. A vertical merger into six pure-play companies and the probability of an asset sale (steel business in Q1 or Q2FY25) can drive further upside from the current levels. For Hindalco, an update on Novelis IPO and its proceeds will be the key monitorable and critical risk.

Both Hindalco and Vedanta offer distinct advantages, however, more experts favor Hindalco. Hindalco’s strategic positioning in high-growth downstream sectors and consistent operational performance make it an attractive option for long-term investors. Vedanta’s potential demerger and diversified portfolio present opportunities but come with some risks due to debt obligations.

Coforge share price declines 9% post-Q4 earnings performance: Should you sell or Hold the stock?

Stock Market Today: The Coforge share price Ltd was corrected by more than 9% during the morning trades on Friday. The company posted Q4 earnings performance on Thursday post-market hours

Stock Market Today: During Friday’s morning trading, Coforge Ltd.’s share price had a correction of over 9%. Coforge Ltd. released its Q4 financial results after market hours on Thursday.

For the quarter that ended in March of 2024, Coforge recorded a 95% increase in net profit to ₹224 crore. Consolidated sales for the three months ending March 31 rose 8.7% year over year to ₹2,359 crore.

However, the performance fell short of some experts’ projections.

In response to the results, analysts at Jefferies India Pvt Ltd stated that the performance was below average overall.

Jefferies downgrades ratings 

Coforge’s 4QFY24 revenues of US$287 million (rising 1.9% sequentially in constant currency terms), a 65bps sequential rise in EBITDA margins, and normalized profit of Rs2.3 billion, all were both below expectations, said analysts at Jefferies.

The main negative surprise in the results was the slower-than-expected margin expansion as per Jefferies. Top-5 customers and Banking Financial Services (up 6.4% sequentially) were the primary drivers of revenue growth.

Who was Joshua Dean? Boeing Whistleblower Dies. “Sudden, Fast-Spreading Infection,” Says Report.

The IT companies see a slowdown in spending by clients leading to uncertainties over revenue and profitability outlook.

At $775 million, Coforge’s fresh order intake was robust, bolstered by two significant agreements. However, a significant negative surprise was that Coforge did not provide growth guidance for FY25 which as per analysts at Jefferies implies increased demand uncertainty.

Amid moderating growth and repeated disappointment on margins, a large acquisition as per Jefferies adds another layer of execution risk, warranting a derating. Coforge has signed a definitive agreement to take over Cigniti Technologies Limited.

Besides an Imminent QIP should be an overhang, too as per Jefferies who have cut their earnings estimates by 11-16% and lowered their target price to Rs4,290 based on 20 times price to earnings valuations and hence have downgrade rating to underperform

Coforge share price

Who is Kishori Lal Sharma, Congress’s Amethi pick?

Antique Stock Broking cuts target price

Analysts at Antique Stock Broking have lowered Coforge’s target price to ₹6,200 (from ₹6,900 earlier) as have lowered their forward valuation (price to earnings) multiples to 30 times (from 32 times earlier) due to the reduced near-term growth outlook. They expect some slowdown in Coforge’s growth in FY25 after reporting strong double-digit growth in FY24. 

PhillipCapital Institutional Equity Research remains optimistic about the FY25 Outlook and maintains a Buy Rating

Phillip Capital in their post-result report said that they now value Coforge at 28 times FY26 EPS (versus 30 times earlier) on lower margins. Their Price target stands at ₹6030 (versus ₹7110 earlier)

Conference League semi-final first leg: Olympiacos upset Aston Villa.

A strong order intake year to date, a strong 12-month executable order book, a healthy large deal pipeline, and a travel vertical (18% of revenue) rebounding after weak FY24 performance, should help Coforge’s growth to remain in the leader’s quadrant, believe analysts at PhillipCapital. 

Analysts at PhillipCapital said that Prima facie the acquisition seems to fill in the portfolio gaps within Coforge, however successful integration will be key given the size (20% of Coforge Revenue).

Nithin Kamath of Zerodha praises Sebi’s action to increase retail bond market participation.

Jirodha is the Chief Executive Officer Nithin Kamath: The Securities and Exchange Board of India (SEBI) decided on Tuesday to lower corporate bonds’ face value from the current ₹1 lakh to ₹10,000 to encourage individual investors to participate in the debt market.

Nithin Kamath, the co-founder of Zerodha, has praised SEBI’s recent decision to cut the face value of corporate bonds. Kamath feels that bonds are a better first step for most Indians than stocks because they offer higher returns than fixed deposits and a lower risk than stocks.

It is thought that by reducing the face value of corporate bonds from the current ₹1 lakh to ₹10,000 from Tuesday, capital market regulator Securities & Exchange Board of India (SEBI) will encourage more retail investors to participate in the debt market.

The Men’s T20 World Cup 2024 kits have been made public so far.

“Companies can now issue bonds with a face value of ₹10,000. This is a great move that can help attract retail participation in the bonds. With all the changes in the last few years, SEBI has done an amazing job of making bonds accessible to small investors,” Kamath wrote in a post on X.

Kamath had earlier spoken out against the non-availability of bonds to retail investors. Bonds have been an HNI product, and no one sold them to retail, he had said.

“There were two big issues: 1. Availability of bonds with small face values. Most bonds are issued through private placements and have face values of ₹10 lakh+. So retail investors were priced out. 2. All bond deals had to be settled through the clearing corporations, and they only accepted RTGS as a payment mode. So the minimum transaction size became ₹2 lakh + by default,” Kamath wrote in January 2023.

The T20 World Cup squad is named after defending winners England.

However, Sebi has made some key changes that make it easy for retail investors to invest in corporate bonds, he noted.

Apart from lowering the denomination, Sebi has standardized the record date for identifying eligible holders, harmonized the format of the due diligence certificate provided by the debenture trustee, and provided flexibility regarding the publication of financial results in newspapers for entities that have listed only non-convertible securities.

Philippines Claims China Coast Guard Damaged Its Vessel and Fired Water Cannons.

Sebi board also approved the proposal to provide an option to the issuers to issue NCDs or NCRPS through private placement mode at a reduced face value of ₹10,000 along with the requirement to appoint a merchant banker.

Such non-convertible debentures (NCDs) and non-convertible redeemable preference shares (NCRPS) should be plain vanilla, interest or dividend-bearing instruments. However, credit enhancements would be permitted in such instruments.

The regulator also approved the proposal that the record date for the payment of interest repayment of principal of debt securities or NCRPS should be 15 days before the due dates of such payment obligations.

Nifty 50 and Sensex today: What we can expect from the Indian stock market on April 29th.

Nifty 50 and Sensex today: The Indian standard index is out to a strong start, according to Gift Nifty’s trends. The Gift Nifty was trading at a premium of around 100 points over the previous closing of the Nifty futures, at 22,655.

The Monday opening of the Sensex and Nifty 50 Indian stock market indices is anticipated to be higher due to favorable indications from the global market.

The Indian benchmark index is out to a strong start, according to Gift Nifty’s trends. The Gift Nifty was trading at a premium of around 100 points over the previous closing of the Nifty futures, at 22,655.

The domestic equity indices closed more than half a percent down on Friday, ending a five-day winning streak.

The Nifty 50 closed 150.40 points, or 0.67%, lower at 22,419.95, while the Sensex dropped 609.28 points to conclude at 73,730.16.

On the daily chart, Nifty 50 developed a long negative candle on Friday right next to the long bull candle on Thursday.

India-bound ship attacked by Houthis in Red Sea; details here

At the highs, this indicates the formation of a bearish dark cloud cover-type candle pattern. The fact that Nifty pulled back in the following session after decisively breaking over the critical downside gap barrier of April 15 around 22,500 levels on Thursday may not be a good sign for bulls, according to Nagaraj Shetti, Senior Technical Research Analyst at HDFC Securities.

On the weekly chart, a little, positive candle with a long upper shadow formed. The market appears to have established a lower high this week following a string of higher high patterns.

“The Nifty’s short-term trend appears to have turned negative following a sensible recovery from the lows. The 22,300 mark serves as immediate support, and any weakness below it could lead to further falls in the future, according to Shetti.

What to anticipate from Bank Nifty and Nifty 50 today is as follows:

Nifty 50 Prediction

On April 26, the Nifty 50 index had a severe U-turn to the downside, ending the day 150 points lower.

“Throughout the session, selling pressure on the Nifty persisted as the index was unable to hold above the critical threshold of 22,500. A heavy cloud cover pattern on the daily chart suggests a possible bearish reversal. The Nifty could extend its losses towards 22,000 below the immediate support level of 22,300, according to Rupak De, Senior Technical Analyst at LKP Securities.

On the other hand, he believes the level of 22,500 might act as a technical resistance for the Nifty.

Elvish Reaction On Fukra Insaan (Abhishek Malhan) Entry into the Playground 3.

Bank Nifty Prediction

Bank Nifty Prediction

On the daily charts, the Bank Nifty index formed a bearish candlestick pattern as it fell 294 points to close at 48,201 on Friday.

“Despite selling pressure from higher levels, the Bank Nifty index held onto the critical 488,000 support level.” Kunal Shah, Senior Technical & Derivative Analyst at LKP Securities, stated that “as long as it stays above this level, where significant open interest is concentrated on the put side, the bullish sentiment will persist.”

The immediate barrier is currently at 48,600, and Shah noted that a significant advance over this level may open the door for new all-time highs in the index.

Sensex is down 600 points, and Nifty begins below 21,850, with Wipro, Bajaj Auto, and Infosys in the spotlight.

Nifty opened below 21,850, and Sensex was down 600 points: The following industries had a decrease in stock prices: real estate, healthcare, consumer durables, oil & gas, automotive, financial services, FMCG, IT, metal, pharma, PSU Bank, and private banks.

The domestic market opened lower in today’s business session. Nifty is below 21,850 and Sensex is at 71888. The Sensex slipped to 600 points, while the Nifty fell to 183 points.
However, midcap and smallcap stocks have seen weakness. BSE’s midcap index is trading up to 1.44 percent lower, while Nifty’s midcap 100 index is down 1.75 percent. BSE’s small cap index is trading down 1.32 percent.

Currently, BSE’s 30-share flagship
index Sensex is trading at 71888.34, down 600.65 points or 0.83%. While NSE’s 50-share flagship index Nifty is trading at 21812, down 183.80 points or 0.84%.
Auto, Financial Services, FMCG, IT, Metal, Pharma, PSU Bank, Private Bank, Realty, Healthcare, Consumer Durables and Oil & Gas stocks were
seen with declines of 0.62-2.14%.
Bank Nifty is trading at 46,686.05, down 0.81 percent.

Infosys Q4 Results Live Updates: Revenue is expected to drop while margin stays constant QoQ; FY25 forecast expected.

Among the leading stocks, BPCL, Bajaj Auto, Infosys, HDFC Life, L&T, LTI Mindtree, Axis Bank, Nestlé India, and TCS fell between 1.25-2.66 percent. While among the giants ONGC, ITC, Apollo Hospitals, Cipla, and Sun Pharma rose by 0.03-2.04 percent.
Midcap stocks Hind Petroleum, Canara Bank, CRISIL, SJVN, and AB Capital fell between 2.62 and 3.54 percent. While IGL, Oil India, Torrent Power, Nippon, and Dilhavery are up 0.14- 0.90 percent.
Among small-cap stocks, Sachendar Infra, Sun Pharma Advertise, Purvankara, Dredging Corp, and Ganesh Housing fell 4.38-5 percent. However, among the smallcap stocks Visuvis India, Tallbros Auto, Wari Renewables, Brannariaman, and Transforms rose by 3.89-5.79 percent.

Indian stock market: Over the weekend, 7 significant factors affected the market: the Gift Nifty, US nonfarm payrolls, and oil prices.

Indian stock market: The Gift Nifty was trading at a premium of more than 40 points from the previous closing of the Nifty futures, at 22,650, suggesting that the Indian stock market indices are off to a good start.

Indian stock market On Monday, the local equities market is anticipated to start higher, reflecting advances in its international counterparts due to optimistic sentiment.

Following a stunning jobs report on Friday, the US stock market surged while Asian markets mainly saw gains.

This week’s main macroeconomic and corporate data releases will determine the direction of the market.

The first set of corporate results for the fourth quarter of FY24 (Q4FY24), inflation data from India and the US, minutes from US Federal Reserve meetings, policy meetings of the European Central Bank (ECB), corporate announcements, crude oil prices, outflows of foreign capital, and other global cues are some of the factors that set off the stock market.

On Friday, the domestic equity indices ended flat after the Reserve Bank of India (RBI) announced its monetary policy in line with expectations. The central bank kept the key policy repo rate unchanged at 6.5% and maintained its policy stance as ‘withdrawal of accommodation’.

The Sensex rose 20.59 points, or 0.03%, to close at 74,248.22, while the Nifty 50 settled flat at 22,513.70.

Also Read: Signs and Symptoms of Pancreatic Cancer!

Here are key global market cues for Sensex today:

Asian Markets

Asian markets traded mixed on Monday ahead of key economic data from the region. Japan’s Nikkei 225 rallied 1.01%, while the Topix gained 0.77%. South Korea’s Kospi fell 0.17% and the Kosdaq declined 0.76%. Hong Kong’s Hang Seng index futures indicated a stronger opening.

Gift Nifty Today

Gift Nifty was trading around the 22,650 level, a premium of over 40 points from the Nifty futures’ previous close, indicating a positive start for the Indian stock market indices.

Wall Street

US stock market indices ended higher on Friday after a strong jobs report.

The Dow Jones Industrial Average gained 307.06 points, or 0.80%, to 38,904.04, while the S&P 500 rallied 57.13 points, or 1.11%, to 5,204.34. The Nasdaq Composite ended 199.44 points, or 1.24%, higher at 16,248.52.

For the week, the Dow fell 2.3%, the S&P 500 dropped 1% and the Nasdaq declined 0.8%.

Also Read: Wall Street week ahead: Investors eye inflation data, Fed minutes after strong March jobs report

US Nonfarm Payrolls 

US employers hired far more workers than expected in March while raising wages. As per Labor Department’s employment report, US nonfarm payrolls increased by 303,000 jobs last month. Economists polled by Reuters had forecast 200,000 jobs, with estimates ranging from 150,000 to 250,000.

US Unemployment Rate

The US unemployment rate fell to 3.8% last month from 3.9% in February, remaining below 4% for 26 straight months, the longest such stretch since the late 1960s. According to the Labor Department data, Average hourly earnings rose 0.3% in March after gaining 0.2% in the prior month, while wages increased 4.1% on a year-on-year basis, the smallest gain since June 2021, after advancing 4.3% in February.

Oil Prices

Crude oil prices declined over 1% in early Asian trade on Monday as tensions in the Middle East eased.

Brent crude futures fell 1.79% to $89.54 a barrel, while US West Texas Intermediate crude dropped 1.78% to $85.36 a barrel.

US Treasury Yields

US treasury yields and the dollar rose on Friday after a blowout US jobs report suggested the Federal Reserve may delay cutting interest rates while it awaits further inflation data, Reuters reported. The yield on benchmark 10-year Treasury notes rose to 4.422%. The dollar index, a measure of the US currency against six major peers, edged up 0.11% to 104.41.

In Conclusion

Numerous factors contributed to the notable volatility in the Indian stock market over the weekend. Gift Nifty launch, US nonfarm payrolls, and oil prices all had a significant impact on how investors felt and how the markets moved. The aforementioned advancements highlight the interdependence of worldwide economic phenomena and their significant influence on the financial markets of India. Choosing to make investments with caution and knowledge becomes more crucial as investors work their way through the complexity of these outside forces. Although market volatility can pose difficulties, it also presents shrewd investors with the chance to profit from new trends and tactical openings.

Remaining alert, adaptable, and educated is crucial in the constantly changing Indian stock market to successfully navigate choppy waters and make long-term investments.

Today’s stock market: An explanation of the 13% increase in SpiceJet’s share price!

Today's stock market

Today’s stock market: SpiceJet share price today opened upside and went on to touch an intraday high of ₹71.90 apiece on NSE

Stock market today: Amid the bull trend in the Indian stock market, SpiceJet shares witnessed strong buying interest during Friday deals. SpiceJet share price today opened upside and went on to touch an intraday high of ₹71.90 apiece, logging around 13 percent intraday rise against its Thursday close of ₹63.63 apiece on NSE. While climbing to the intraday high, the aviation company’s stock came close to its existing 52-week high of ₹77.50 that it had achieved on 5th February 2024.

According to stock market experts, the DGCA (Directorate General of Civil Aviation) has released the January 2024 data in which it has reported that the low-cost carrier has managed to hold on to its market share in January 2024. 

Also Read: Treasurer Ajay Maken explains why the IT department blocked the bank accounts of Congress!

The DGCA data shows that SpiceJet has managed to hold on to its market share at 5.6 percent in January 2024. The DGCA data also reported that passenger traffic surged by 4.7 percent in January 2024.

DGCA data in focus

Speaking on the reason for the rise in SpiceJet shares, Avinash Gorakshkar, Head of Research at Profitmart Securities said, “The aviation stock is rising after the release of DGCA January data. In this data, SpiceJet has been reported holding on to its market share of 5.6 percent and the market is expecting benefits for the listing aviation company after DGCA reports a 4.7 percent rise in the number of flight passengers in January 2024.”

Gorakshkar said that the trigger is for the short term, and profit-booking on higher levels may trigger if there is no rebound after the current retracement from intraday’s high.

SpiceJet share price target

On the outlook of SpiceJet shares, Sumeet Bagadia, Executive Director at Choice Broking said, “SpiceJet shares are currently trading in the ₹60 to ₹75 per share range. the aviation stock may become highly bullish on breaching the upper hurdle of the current range whereas it may go further down if it breaches the lower support of its current range. So, a bullish or bearish trend can be assumed on the breakage of either side of the current range. SpiceJet shareholders are advised to hold the scrip maintaining stop loss below ₹60.”

Also Read: Viral video: Zookeeper dares to sit amongst boxful of massive pythons, internet is shocked

This Article Was Originally Published On livemint.com!

India now has the fourth-largest stock market in the world, overtaking Hong Kong!

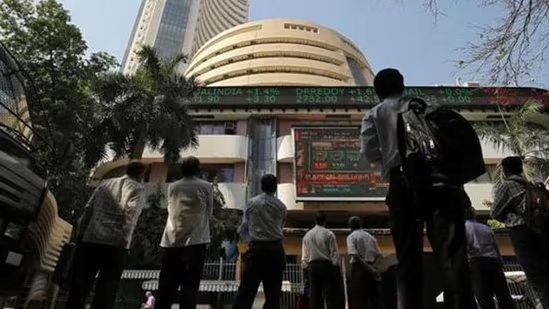
Sensex results on the facade of the Bombay Stock Exchange (BSE) building in Mumbai, India.

Indian exchanges value reach $4.33 trillion, exceeding Hong Kong’s $4.29 trillion: Bloomberg data.

India’s stock market has surpassed Hong Kong’s for the first time with the total value of shares listed on Indian exchanges reaching $4.33 trillion as of Monday’s close, exceeding Hong Kong’s $4.29 trillion, according to Bloomberg data. This makes India the world’s fourth-largest equity market.

The stock market capitalisation surpassed $4 trillion on December 5, with about half of that coming in the past four years, the report added.

Indian equities are surging, fuelled by a growing base of retail investors and robust corporate earnings. India presents itself as a viable alternative to China, attracting global capital and companies due to its stable political environment and a consumption-driven economy among the fastest-growing globally, according to the report.

Ashish Gupta, CIO at Axis Mutual Fund in Mumbai, expressed optimism, saying, “India has all the right ingredients in place to set the growth momentum further.”

China’s appeal as a global growth engine has diminished’

This upward trajectory in Indian stocks contrasts sharply with Hong Kong, which has experienced a historic downturn. Factors contributing to Hong Kong’s decline include stringent anti-Covid-19 measures in Beijing, regulatory crackdowns, a property-sector crisis, and geopolitical tensions with the West, the report said.

This has diminished China’s appeal as a global growth engine, resulting in a significant equities downturn, with Chinese and Hong Kong stocks losing over $6 trillion in total market value since their 2021 peaks, according to the report. Hong Kong’s role as a prominent hub for initial public offerings has waned amid the turmoil, it added.

This article is sourced from Hindustantimes News!

Also Read : IAF choppers shower flowers on Ram Temple after idol face revealed!